An overview of how to work with accumulated data values such as total precipitation.
Certain data variables returned by the Spire Weather API represent forecast-total accumulated values since the start of the forecast, rather than fixed interval accumulations such as 6 hour or 24 hour values.
Some notable examples of such variables are:
- Basic Bundle
- Total Precipitation
- Renewable Energy Bundle
- Surface Net Downward Shortwave Flux
- Agricultural Bundle
- Surface Net Downward Shortwave Flux
- Surface Net Downward Longwave Flux
- Surface Net Upward Shortwave Flux
- Surface Net Upward Longwave Flux
- Net Upward Longwave Flux at Top of Atmosphere
Without any post-processing, the values from an accumulated variable would look like this:
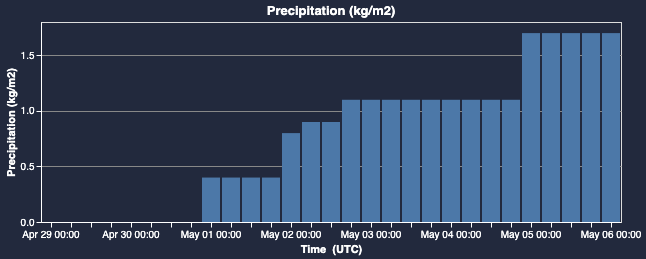
Over the course of the forecast's time-range, the values will only ever increase - since they are accumulating since the beginning of the forecast window.
With some simple post-processing on the data output, it is possible to get the difference between each value and the value that precedes it. Visualizing the result of this process would yield this:
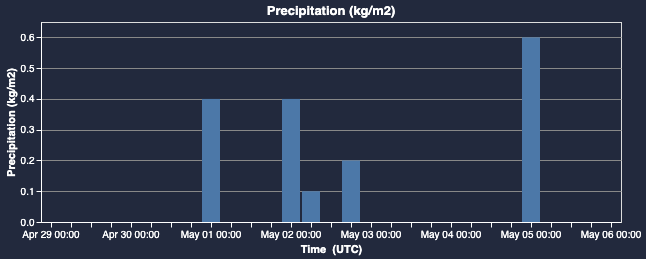
In both of these graph figures, the same exact data is being shown. They are simply 2 different methods of interpreting the data.
Code Sample
Here is a code sample using the Weather Forecast Point API which demonstrates how a user could create 6-hour accumulations from the forecast-total value by differencing the totals from adjacent lead times.
For general information on types of precipitation, please see here.