An overview of the Weather Forecast Optimized Point API endpoint and JSON data output.
Both of the Point APIs are used in similar ways, and both output JSON data in the same format, but there are some key differences between the two products.
Please note that the Optimized Point API and Point API are not the same thing.
To avoid repetition, this article will assume that the reader is already familiar with topics covered here such as a general overview of JSON data output.
Despite the same output format, the Optimized Point API does not offer the same bundle options as the standard Point API. For the complete list of the data variables currently offered in the Optimized Point API, please refer to the bottom of this article.
Why are there 2 APIs for point locations?
Data returned by Spire Weather's standard Point API, File APIs, and OWS/WMS API all comes from the same place: Spire's in-house global weather forecast model. Despite the different output formats (JSON, GRIB2, and WMS) each of these APIs convey information from a common source.
On the other hand, data returned by the Optimized Point API is the product of a different process. The system that produces this data is based on Spire's global model, but is optimized for fixed point locations by leveraging machine learning, multiple forecast systems, and local sensor sources. Since this process is dependent upon accurate, reliable, and well-maintained weather stations, Spire is very selective about the local sources it uses.
Maritime ports and especially airports all over the world are required to operate such stations, and are held to a very high standard of quality assurance. Without accurate observations of current weather conditions, every flight could potentially be at risk. This is why the Optimized Point API is initially only available at locations with airports, maritime ports, or well-known weather stations - to ensure the highest possible quality of information available.
Qualified custom locations can also be discussed for interested clients.
Global Coverage
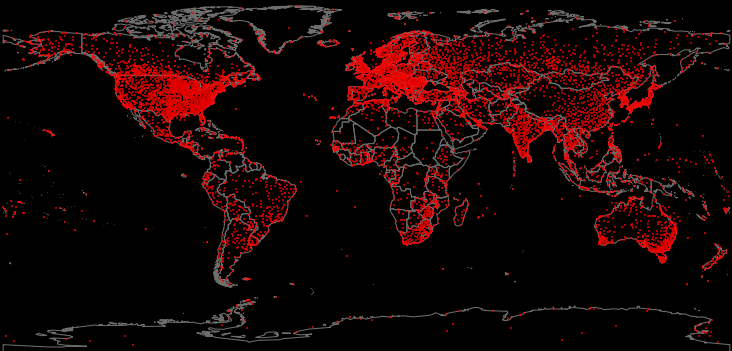
This map shows the locations (~10k) where optimized forecasts are currently available.
When are forecasts issued?
Spire's Optimized Point Forecast is updated every hour.
How are Optimized Point locations specified?
Rather than latitude and longitude inputs used in the standard Point API, location inputs for the Optimized Point API are string values representing either an ICAO airport identifier, a WMO station identifier, or a UN/LOCODE identifier for a maritime port.
- ICAO: International Civil Aviation Organization
- ICAO airport identifiers are four-letter codes representing aerodromes
- Examples:
- RJTT - Tokyo Haneda Airport (WMO: 47671)
- OMDB - Dubai International Airport (WMO: 41194)
- KLAX - Los Angeles International Airport (WMO: 72295)
- YSSY - Sydney Airport (WMO: 94767)
- WMO: World Meteorological Organization
- WMO station identifiers are five-digit numeric codes representing weather stations
- Examples:
- 68368 - O.R. Tambo International Airport (ICAO: FAOR)
- 03772 - London Heathrow Airport (ICAO: EGLL)
-
-
- 54511 - Beijing Capital International Airport (ICAO: ZBAA)
- 72530 - O'Hare International Airport (ICAO: KORD)
-
- UN/LOCODE: United Nations Code for Trade and Transport Locations
- Geographic coding scheme developed and maintained by United Nations Economic Commission for Europe (UNECE)
- Examples:
- NLAMS - Port of Amsterdam (Netherlands)
- USHOU - Port of Houston (Texas, USA)
- SGSIN - Port of Singapore (Singapore)
- JPTYO - Port of Tokyo (Japan)
Example Input:
API input locations begin with a namespace string indicating what kind of location is being requested. The currently supported namespaces are icao: or wmo: or unlocode:
https://api.wx.spire.com/forecast/point/optimized?location=icao:KJFK
https://api.wx.spire.com/forecast/point/optimized?location=wmo:74486
https://api.wx.spire.com/forecast/point/optimized?location=unlocode:NLAMS
Output (JSON):
Available Data Variables
As mentioned previously, the data bundles offered for other API endpoints do not apply to the Optimized Point API.
Here is the complete list of data variables currently offered in the Optimized Point API:
|
Field Name |
Vertical Level |
Description |
Units |
|
Temperature |
2 meters AGL |
Air temperature at standard observation height (2 m above the surface) |
K |
|
Dewpoint temperature |
2 meters AGL |
Temperature at which a parcel of air cooled at constant pressure and specific humidity reaches saturation |
K |
|
Relative humidity |
2 meters AGL |
The fractional ratio of the partial pressure of water vapor to the equilibrium vapor pressure at a given temperature, expressed as a percentage |
% |
|
24-h Maximum temperature UTC |
2 meters AGL |
Maximum air temperature for the remainder of the current calendar day (day in UTC time - same across all stations) For example, at 18 UTC, the Maximum Temperature is predicted for the period between 19:00 and 23:59. |
K |
|
24-h Minimum temperature UTC |
2 meters AGL |
Minimum air temperature for the remainder of the current calendar day (day in UTC time - same across all stations) |
K |
|
24-h Maximum temperature local |
2 meters AGL |
Maximum air temperature for the remainder of the current calendar day (day in the station local time zone) |
K |
|
24-h Minimum temperature local |
2 meters AGL |
Minimum air temperature for the remainder of the current calendar day (day in the station local time zone) |
K |
|
Mean sea-level pressure |
Sea level |
Air pressure adjusted to mean sea level |
Pa |
|
Cloud ceiling |
Surface |
The height above the Earth's surface of the base of the lowest layer of cloud with a coverage of more than 50%. Data is provided in ranges For example, “0 to 800 m” or “No Ceiling” |
m (range) |
|
Total cloud cover |
Surface |
The percentage of the sky around the location covered by clouds |
% |
|
Visibility |
Surface |
The horizontal visibility |
m |
|
Probability of fog |
Surface |
The probability of fog |
% |
|
Probability of thunderstorm |
Surface |
The probability of thunderstorm |
% |
|
Wind speed |
10 meters AGL |
The wind speed at standard observation height (10 m above the surface) |
m/s |
|
Wind direction |
10 meters AGL |
The meteorological wind direction (90° corresponds to wind from east) |
degrees |
|
Eastward wind velocity |
10 meters AGL |
The eastward component of the horizontal wind. It is the horizontal speed of air moving towards the east |
m/s |
|
Northward wind velocity |
10 meters AGL |
The northward component of the horizontal wind. It is the horizontal speed of air moving towards the north |
m/s |
|
Wind Gust Speed |
10 meters AGL |
Instantaneous wind gust speed |
m/s |
|
Precipitation Rate |
Surface |
The rate of total precipitation at the specified time (e.g., the amount of rain that would fall over a given interval of time if the rainfall intensity were constant over that time period) |
mm/s |
|
1-h Probability of precipitation |
Surface |
The probability of (liquid) precipitation in the next one hour |
% |
|
1-h Accumulated precipitation |
Surface |
The total accumulated (liquid) precipitation occurring in the next one hour |
mm |
|
3-h Probability of precipitation |
Surface |
The probability of (liquid) precipitation in the next three hours |
% |
|
3-h Accumulated precipitation |
Surface |
The total accumulated (liquid) precipitation occurring in the next three hours |
mm |
|
6-h Probability of precipitation |
Surface |
The probability of (liquid) precipitation in the next six hours |
% |
|
6-h Accumulated precipitation |
Surface |
The total accumulated (liquid) precipitation occurring in the next six hours |
mm |
|
24-h Probability of precipitation |
Surface |
The probability of (liquid) precipitation in the next 24 hours |
% |
|
Conditional probability of rain |
Surface |
Conditional probability of rain. Likelihood of receiving rain if precipitation were actually to occur. |
% |
|
Conditional probability of snow |
Surface |
Conditional probability of snow. Likelihood of receiving snow if precipitation were actually to occur. |
% |
|
Conditional probability of ice |
Surface |
Conditional probability of ice (freezing rain or sleet). Likelihood of receiving ice if precipitation were actually to occur. |
% |
Cloud Ceiling Notes
- The first is total_cloud_cover which is a percentage between 0 and 100.
- The second is ceiling which is an altitude range, with values like 944-1676 m
Cloud ceiling has two components: there must be a certain amount of clouds (broken or overcast coverage) and they must be below a certain level (typically 12,000 ft).
100% coverage of high, thin clouds (like you'd see outside an airplane window) won't give you a ceiling value but would be considered for the total_cloud_cover value.